Demonstrate Crime Threats Through Mapping
One Mile Radius of Downtown Houston
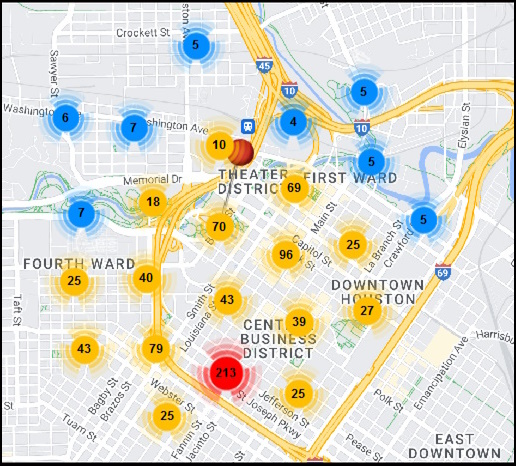
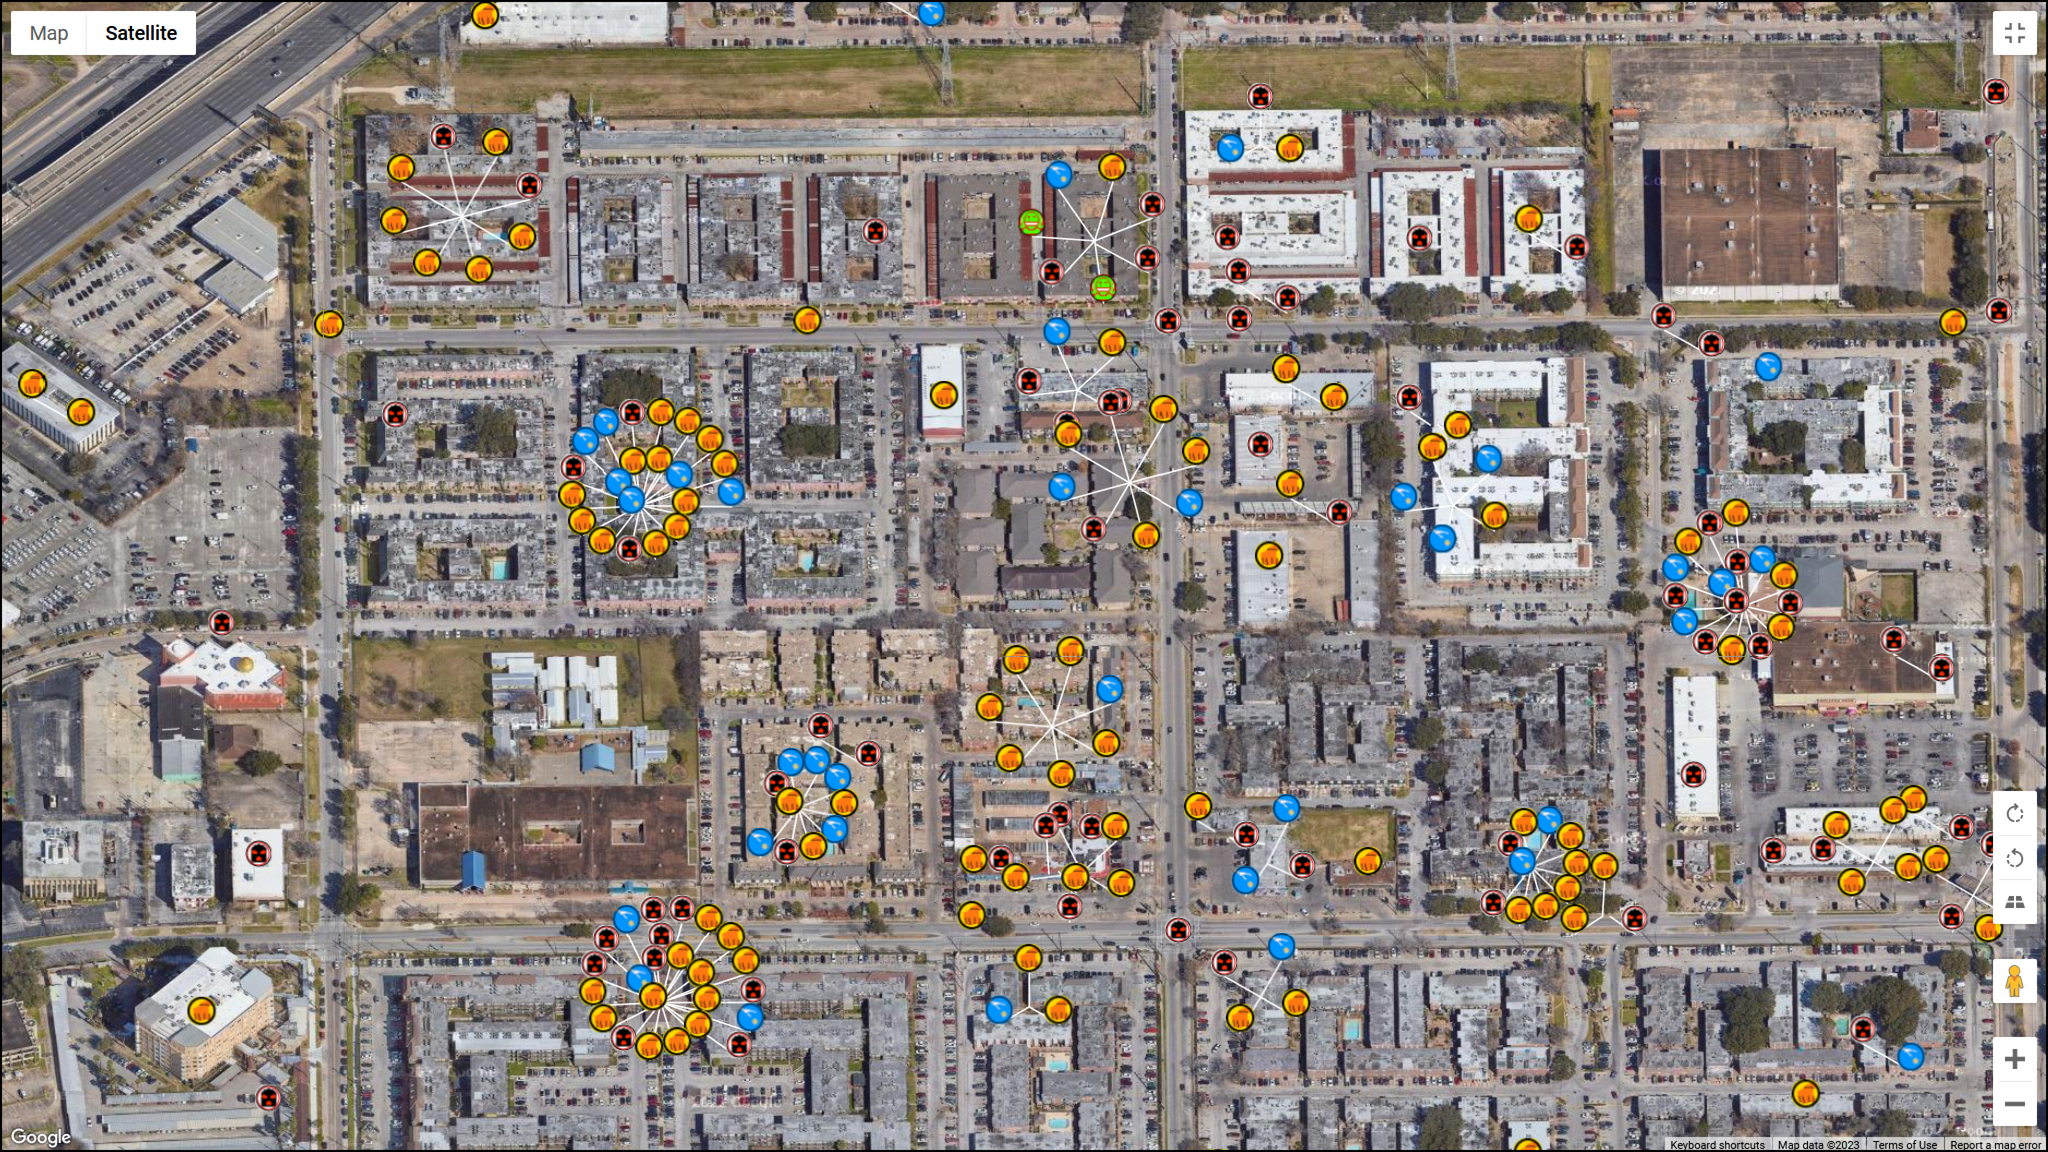
Houston Crime Stats is provided through LPT Security Consulting. The crime statistics data from the Houston Police Department is now available for any address and within a one mile radius.
Houston is no different than any metropolitan area: crime can occur anywhere. When you want crime data for a specific address, the information is very difficult to find. The crime statistics from the Houston Police Department are the basis for the 80,000 crimes in the database.
A free trial is offered to test drive the search process and the report produced in .pdf.
Contact us today for more details or call us 713-899-2402